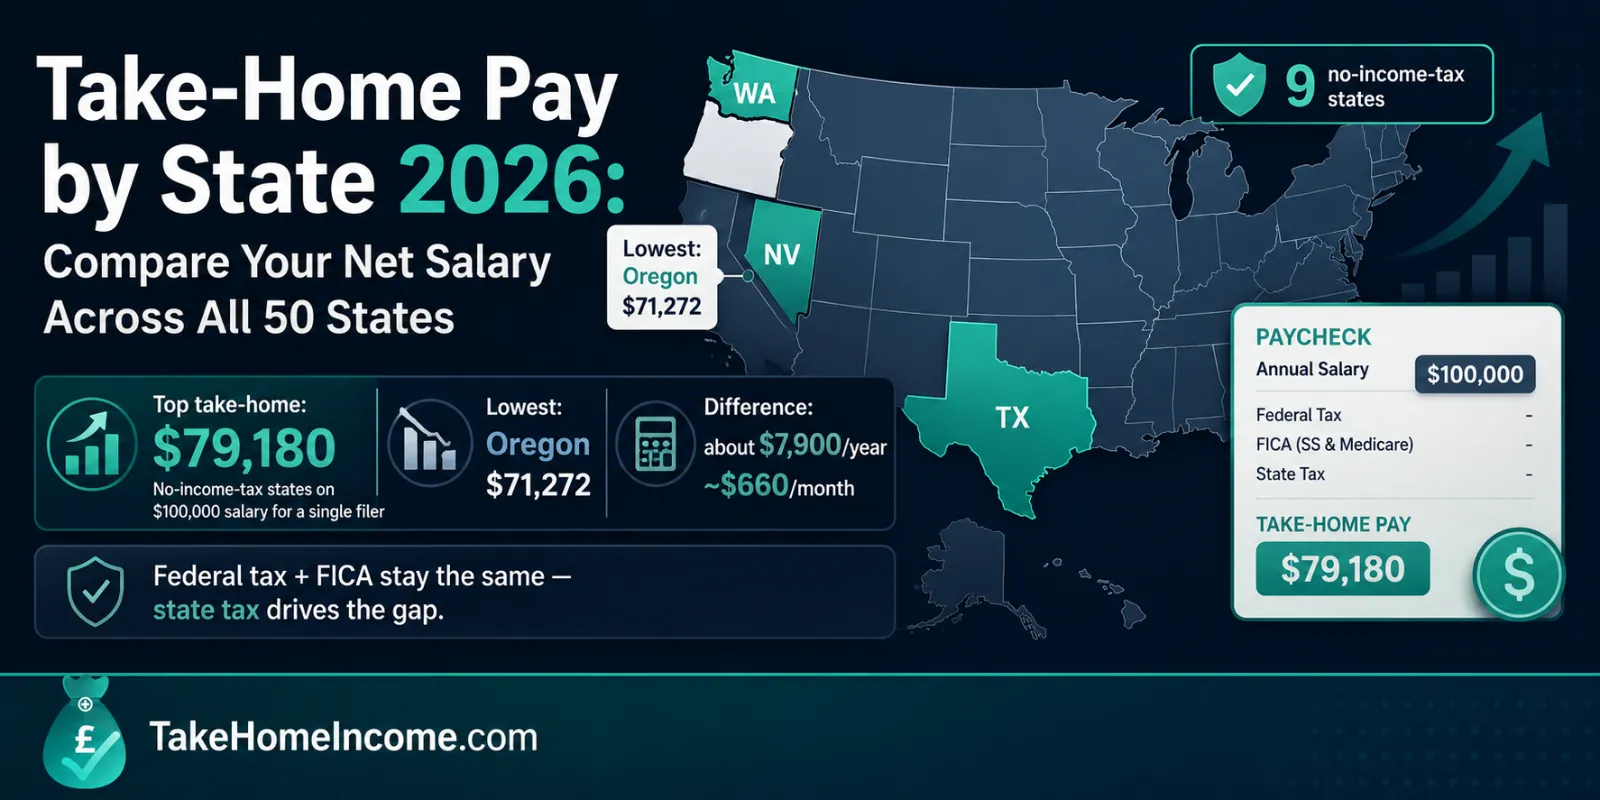
Want to compare take-home pay by state for 2026? Here is the headline: on a $100,000 salary, a single filer keeps the most – $79,180 a year – in any of the nine states with no income tax, and the least in Oregon at about $71,272. That is a swing of roughly $7,900 a year (around $660 a month) for the exact same paycheck, driven entirely by state income tax and a handful of mandatory state payroll premiums. Federal income tax and FICA are identical in every state, so the whole difference is what your state takes. Below you will find every state ranked, the nine no-tax states named, and the hidden property- and sales-tax offsets that stop the ranking from telling the whole story.
How do I compare take-home pay across states?
The fastest way is to hold three things constant – salary, filing status and tax year – and change only the state. When you do that, the comparison becomes clean because two big deductions never move:
- Federal income tax is the same everywhere. On $100,000 single in 2026, taxable income is $100,000 − the $16,100 standard deduction = $83,900, taxed in layers to $13,170.
- FICA is the same everywhere – Social Security at 6.2% (here $6,200, since $100,000 is under the $184,500 wage base) and Medicare at 1.45% ($1,450). Together that is $7,650.
- Only state income tax and state payroll premiums change. A no-income-tax state adds $0; a high-tax state can add $5,000–$7,000-plus. That delta is the take-home difference.
So in a no-income-tax state the deductions are just $13,170 + $6,200 + $1,450 = $20,820, leaving $79,180. Every other state starts from that same baseline and subtracts its own income tax on top. Our US salary after tax calculator does this automatically – pick a state, and federal plus FICA stay fixed while the state layer updates.
All 50 states ranked: net pay on a $100,000 salary (2026)
This is the reference table. Every figure is a single filer on $100,000 for tax year 2026, after federal income tax, Social Security, Medicare, state income tax and any mandatory employee state payroll premiums (such as California SDI or Oregon Paid Leave). The effective rate includes those payroll premiums. States are ranked from highest take-home to lowest; the nine no-income-tax states tie at the top.
| Rank | State | State income tax | State payroll premiums | Net pay (annual) | Effective rate |
|---|---|---|---|---|---|
| 1 | Texas | $0 | $0 | $79,180 | 20.8% |
| 1 | Florida | $0 | $0 | $79,180 | 20.8% |
| 1 | Washington | $0 | $0 | $79,180 | 20.8% |
| 1 | Nevada | $0 | $0 | $79,180 | 20.8% |
| 1 | New Hampshire | $0 | $0 | $79,180 | 20.8% |
| 1 | South Dakota | $0 | $0 | $79,180 | 20.8% |
| 1 | Tennessee | $0 | $0 | $79,180 | 20.8% |
| 1 | Wyoming | $0 | $0 | $79,180 | 20.8% |
| 9 | Alaska | $0 | $271 | $78,909 | 21.1% |
| 10 | North Dakota | $691 | $0 | $78,489 | 21.5% |
| 11 | Arizona | $2,098 | $0 | $77,082 | 22.9% |
| 12 | Ohio | $2,315 | $0 | $76,865 | 23.1% |
| 13 | Louisiana | $2,614 | $0 | $76,566 | 23.4% |
| 14 | Indiana | $2,920 | $0 | $76,260 | 23.7% |
| 15 | Pennsylvania | $3,070 | $70 | $76,040 | 24.0% |
| 16 | Iowa | $3,148 | $0 | $76,032 | 24.0% |
| 17 | Mississippi | $3,268 | $0 | $75,912 | 24.1% |
| 18 | Arkansas | $3,355 | $0 | $75,825 | 24.2% |
| 19 | Kentucky | $3,382 | $0 | $75,798 | 24.2% |
| 20 | North Carolina | $3,481 | $0 | $75,699 | 24.3% |
| 21 | New Mexico | $3,569 | $0 | $75,611 | 24.4% |
| 22 | Nebraska | $3,675 | $0 | $75,505 | 24.5% |
| 23 | West Virginia | $3,691 | $0 | $75,489 | 24.5% |
| 24 | Missouri | $3,767 | $0 | $75,413 | 24.6% |
| 25 | Michigan | $3,999 | $0 | $75,181 | 24.8% |
| 26 | Oklahoma | $4,000 | $0 | $75,180 | 24.8% |
| 27 | Idaho | $4,037 | $0 | $75,143 | 24.9% |
| 28 | Alabama | $4,102 | $0 | $75,078 | 24.9% |
| 29 | Colorado | $3,692 | $440 | $75,048 | 25.0% |
| 30 | Vermont | $4,189 | $0 | $74,991 | 25.0% |
| 31 | South Carolina | $4,244 | $0 | $74,936 | 25.1% |
| 32 | Rhode Island | $3,184 | $1,100 | $74,896 | 25.1% |
| 33 | Montana | $4,289 | $0 | $74,891 | 25.1% |
| 34 | Maryland | $4,384 | $0 | $74,796 | 25.2% |
| 35 | Georgia | $4,391 | $0 | $74,789 | 25.2% |
| 36 | Wisconsin | $4,450 | $0 | $74,730 | 25.3% |
| 37 | Utah | $4,500 | $0 | $74,680 | 25.3% |
| 38 | Kansas | $4,780 | $0 | $74,400 | 25.6% |
| 39 | New Jersey | $4,180 | $610 | $74,390 | 25.6% |
| 40 | Illinois | $4,805 | $0 | $74,375 | 25.6% |
| 41 | Virginia | $4,936 | $0 | $74,244 | 25.8% |
| 42 | Massachusetts | $4,680 | $460 | $74,040 | 26.0% |
| 43 | Connecticut | $4,750 | $500 | $73,930 | 26.1% |
| 44 | New York | $4,952 | $443 | $73,785 | 26.2% |
| 45 | Delaware | $5,097 | $400 | $73,683 | 26.3% |
| 46 | District of Columbia | $5,532 | $0 | $73,648 | 26.4% |
| 47 | Maine | $5,157 | $500 | $73,523 | 26.5% |
| 48 | Minnesota | $5,277 | $440 | $73,463 | 26.5% |
| 49 | Hawaii | $5,796 | $390 | $72,994 | 27.0% |
| 50 | California | $5,055 | $1,300 | $72,825 | 27.2% |
| 51 | Oregon | $7,208 | $700 | $71,272 | 28.7% |
Methodology: figures are computed by our own calculator from 2026 federal brackets (IRS Rev. Proc. 2025-32), 2026 FICA rates (SSA), and each state’s official 2026 income-tax schedule plus mandatory employee payroll premiums. The District of Columbia is shown alongside the 50 states for completeness. Local/city income taxes (NYC, Yonkers, Philadelphia, Ohio municipalities, Maryland counties, etc.) are not included and would lower some of these figures further.
Which states have no income tax?
Nine states levy no personal income tax on wages. Name them and they are the eight-way tie at the top of the table, plus Alaska:
- Alaska – no income tax (a small ~$271 employee unemployment premium is the only state withholding).
- Florida
- Nevada
- New Hampshire – its old tax on interest and dividends was repealed from 1 January 2025, so wages are fully untaxed.
- South Dakota
- Tennessee
- Texas
- Washington – no tax on wage income (it has a separate capital-gains tax that does not touch salary).
- Wyoming
In seven of these, a $100,000 single filer keeps the full $79,180. Alaska is fractionally lower because of its employee unemployment contribution; Washington also runs Paid Family & Medical Leave premiums that are not modelled here, so its real-world net is a touch below the headline.
Does a no-income-tax state always mean more take-home?
For the paycheck, yes – no income tax is the single biggest lever, and it is why those nine states top the ranking. But "more take-home" and "cheaper to live" are not the same thing. States still need revenue, so the no-income-tax states lean harder on other taxes:
- Property tax. Texas (~1.6% effective) and New Hampshire (~1.6%–1.9%) have some of the highest property-tax rates in the country, while income-tax states like California (~0.7%) keep theirs low. A homeowner can hand back a chunk of the paycheck saving in property tax.
- Sales tax. Tennessee and Washington have combined state-and-local sales taxes near 9.5%–10%, among the highest anywhere. Oregon, by contrast, has no sales tax despite a high income tax.
So the honest answer is: a no-income-tax state almost always wins on the payslip, but whether it wins on your total tax bill depends on whether you own a home and how much you spend. The next two sections show how those offsets work.
Why does take-home pay differ so much by state?
Three structural differences explain almost the entire spread in the table:
- No tax vs flat vs progressive. Nine states charge nothing on wages. About a dozen use a single flat rate – for example Pennsylvania at 3.07%, Arizona at 2.5%, Colorado at 4.4% and Illinois at 4.95%. The rest are progressive, with rising brackets like California (1% up to 12.3%) or New York (4% up to 10.9%).
- State standard deductions and credits. A state’s rate is only half the story. Some states (Arizona, Colorado, Georgia) give a large standard deduction that shrinks the taxable base; others (New Jersey, Pennsylvania) give little or none, so a modest-looking rate still raises real money.
- Mandatory state payroll premiums. Several states withhold employee-side disability or paid-leave premiums on top of income tax. California’s 1.3% SDI (no wage cap) adds $1,300 at $100,000; Oregon, Rhode Island, New York, New Jersey, Massachusetts, Connecticut and others add smaller amounts. These are easy to forget but they are real deductions from your pay.
Which state has the highest take-home pay?
For wages, the nine no-income-tax states are tied for first: a single filer on $100,000 keeps $79,180 in Texas, Florida, Washington, Nevada, New Hampshire, South Dakota, Tennessee and Wyoming (and $78,909 in Alaska). Among states that do tax income, the friendliest at this salary are those with a low flat rate or a generous 0% band:
- North Dakota – a large 0% band means just $691 of state tax, the lowest of any taxing state, leaving $78,489.
- Arizona – flat 2.5% on a federal-style base, about $2,098, leaving $77,082.
- Ohio and Louisiana – low effective burdens (around $2,300–$2,600) keep net pay near $76,500–$76,900 before any local taxes.
Which state has the highest taxes for take-home pay?
At $100,000 single in 2026, the states that leave you with the least are:
- Oregon – the lowest net at $71,272 (28.7% effective). Oregon’s progressive rates run up to 9.9% and it adds a 0.6% Paid Leave premium – but remember it has no sales tax, which softens the blow elsewhere.
- California – $72,825 net (27.2%), driven by progressive rates plus the 1.3% no-cap SDI.
- Hawaii – $72,994 net (27.0%), with a top rate of 11% and a low standard deduction.
- Minnesota, Maine and DC – all cluster around $73,500–$73,650 net.
The gap between the best and worst – about $7,900 a year at this salary – widens as income rises, because progressive states keep climbing while the no-tax states stay flat at zero.
The hidden offsets: property and sales taxes
Income tax is the most visible state tax, but it is not the only one. The states that skip income tax usually recover the money elsewhere, so a fair comparison looks at the whole picture. These are illustrative statewide effective averages – your county, city and exemptions change the exact numbers:
| State | State income tax (on $100k single) | Approx. effective property-tax rate | Approx. combined sales tax |
|---|---|---|---|
| Texas | $0 | ~1.6% | ~8.2% |
| Florida | $0 | ~0.9% | ~7.0% |
| Washington | $0 | ~0.9% | ~9.4% |
| Tennessee | $0 | ~0.7% | ~9.5% |
| California | $5,055 (+ SDI) | ~0.7% | ~8.8% |
| Oregon | $7,208 (+ leave) | ~0.9% | 0% (no sales tax) |
Read together with the ranking, the trade-offs are clear: Texas gives you the biggest paycheck but one of the steepest property-tax bills, so homeowners lose part of the saving. Washington and Tennessee pair no income tax with high sales taxes, so heavy spenders pay more at the till. Oregon has the smallest paycheck but no sales tax at all, which can favour big spenders. The state that is genuinely cheapest for you depends on whether you own, rent, and how much you spend – not just the income-tax column.
How does filing status affect take-home pay by state?
Filing status changes both your federal tax and, in most states, your state tax – usually making married filing jointly more favourable than single at the same household income, because brackets and standard deductions roughly double. The state ranking stays broadly similar, but the size of the gap shrinks for couples. At $100,000 in 2026:
| State | Single net | Married filing jointly net | MFJ keeps more by |
|---|---|---|---|
| Texas (no income tax) | $79,180 | $84,710 | $5,530 |
| Pennsylvania (flat 3.07%) | $76,040 | $81,570 | $5,530 |
| New York (progressive) | $73,785 | $79,982 | $6,197 |
| California (progressive) | $72,825 | $81,331 | $8,506 |
Two patterns stand out. First, the jump from single to joint is worth thousands everywhere – mostly from the federal side, which is identical across states. Second, the most progressive states give couples the biggest extra benefit: California’s married filers gain about $8,506 versus single, because its brackets widen sharply, while flat-rate Pennsylvania and no-tax Texas gain a flat $5,530 (the federal-only difference). So a high-income couple feels the pull of a low-tax state less than a single high earner does.
Key takeaways
- On $100,000 single in 2026, take-home ranges from $79,180 to $71,272 – a spread of about $7,900 a year driven entirely by state income tax and state payroll premiums.
- Nine states have no income tax on wages: Alaska, Florida, Nevada, New Hampshire, South Dakota, Tennessee, Texas, Washington and Wyoming. Seven of them leave the full $79,180.
- Federal income tax ($13,170) and FICA ($7,650) are identical in every state at this salary, so the ranking is purely a state-tax ranking.
- Oregon, California and Hawaii keep the least – roughly $71,300–$73,000 net, at effective rates of 27%–29%.
- A no-income-tax state wins the paycheck but not always the total bill: Texas and New Hampshire have high property taxes; Washington and Tennessee have high sales taxes; Oregon has none.
- Married filing jointly keeps more than single at the same income, and the benefit is largest in steeply progressive states like California (~$8,500 more than single).
Compare your own salary across states
This table uses one salary and one filing status – your numbers depend on your income, whether you file single or jointly, and pre-tax deductions like 401(k), HSA and health insurance. Enter your figures once in our US salary after tax calculator, then switch the state to see your real 2026 take-home side by side, federal and FICA held constant while the state layer updates.